
Public Health Data the Community Can Explore
Power BI dashboards for Walworth County Public Health, featured in the county’s 2025 Community Health Assessment.
View the Health Assessment →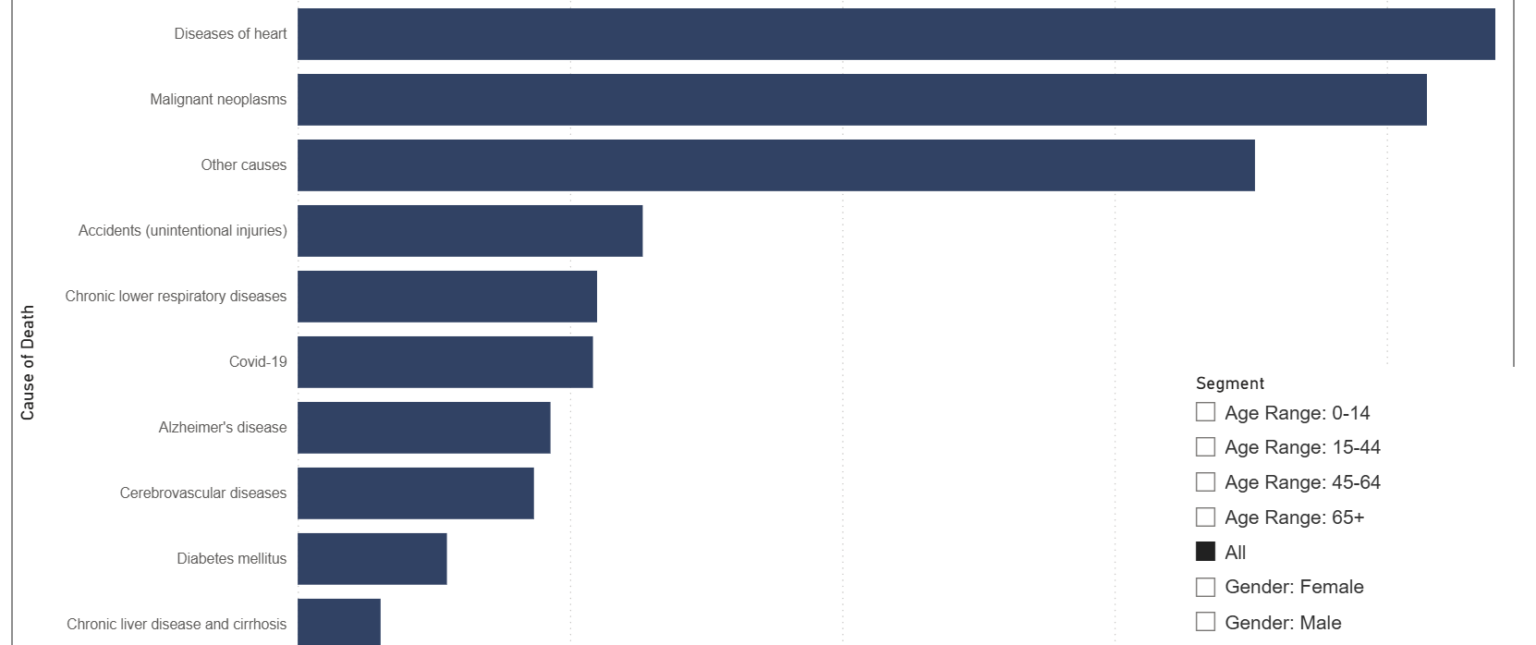
Client
Walworth County Public Health
Organization
County public health department
Platform
Power BI
Services
Dashboards, data modeling, staff training
The Challenge
Walworth County Public Health had six years of hospitalization data (2019–2024) that staff and residents needed to understand at a glance, including how the top causes differ across age, gender, and race/ethnicity.
What I Built
Public Power BI dashboards, hosted on the county’s government Power BI tenant:
- Top Causes of Hospitalizations (2019–2024), with a demographic selector that filters every visual at once across six age bands, gender, and race/ethnicity.
- A leading-causes view so trends are readable without a data background.
- A single causes-of-death view that combines separate segment tables into one dataset with a slicer-driven Segment field, ranking the top 10 causes by death rate per 100,000 so users can switch segments without navigating separate report tabs.
- Troubleshooting and step-by-step guides for the department’s other Power BI reports, so staff can manage them on their own.
The Result
County staff and the public can answer “what’s putting people in the hospital, and who’s most affected?” in a few clicks instead of a data request.
"Cameron has been so helpful, knowledgeable, and quick to respond. He helped our department troubleshoot a number of our problems in Power BI and also created some helpful guides and step-by-step instructions to make our processes easier."
Sabrina E. Walworth County Public HealthSitting on data nobody can use?
I build dashboards your team and community will actually open, and I teach your staff to keep them running.
Let's Talk